GBPUSD Wave analysis and forecast for 14.04 – 21.04

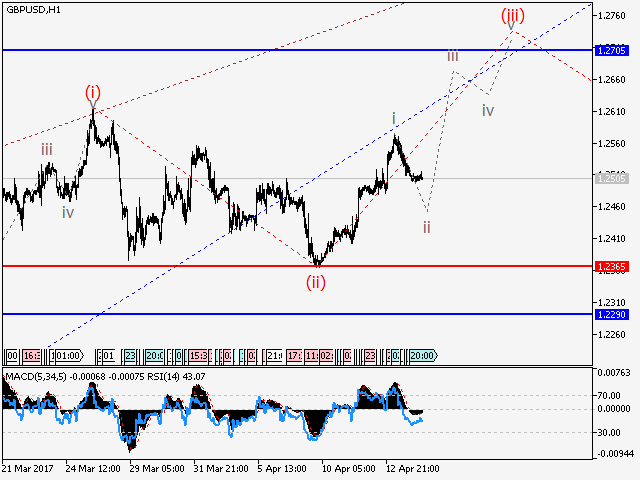
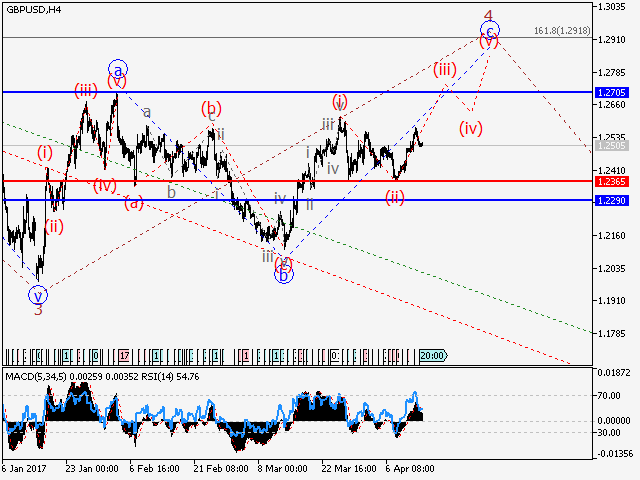
Wave analysis and forecast for 14.04 – 21.04: Uptrend continues.

Estimated pivot point is at the level of 1.2365.

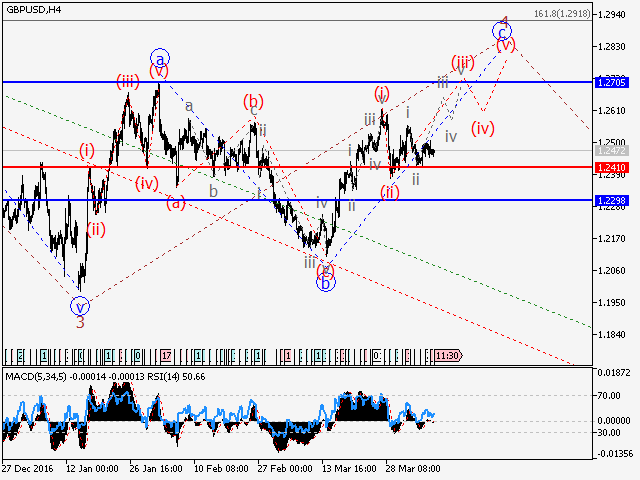
Analysis: Presumably, the formation of the upward correction as the wave 4 of the senior level continues. Within this wave the wave c of 4 is being developed. Locally, it is likely that third wave (iii) of c is being developed. If this assumption is correct, the pair may continue to rise up to 1.2705. Critical level for this scenario is 1.2365.

Alternative scenario: Breakdown and consolidation of the price below the level of 1.2365 will trigger further decline in the pair to 1.2300.

Our opinion: Buy the pair from correction above the level of 1.2365 with the target of 1.2705.

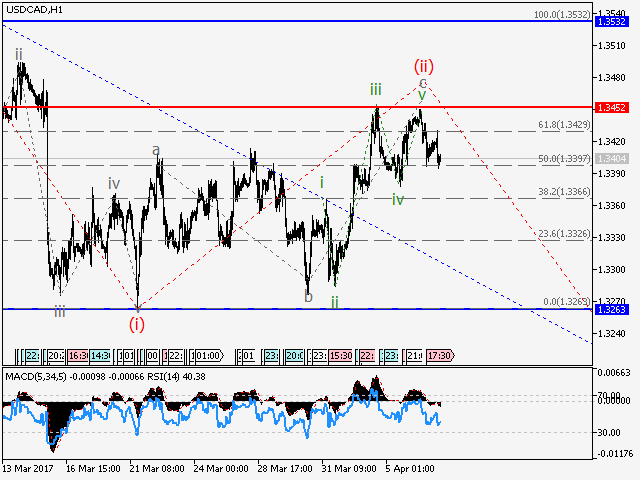
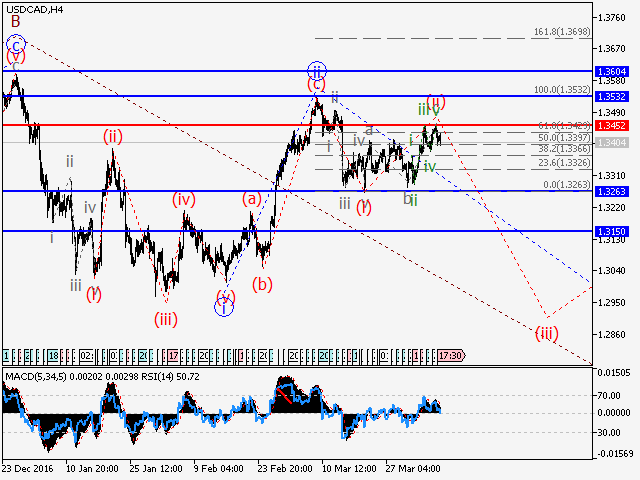
USDCAD Wave analysis and forecast for 14.04 – 21.04

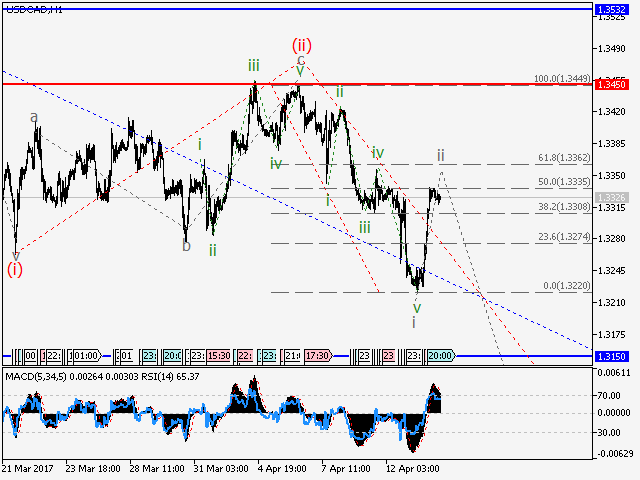
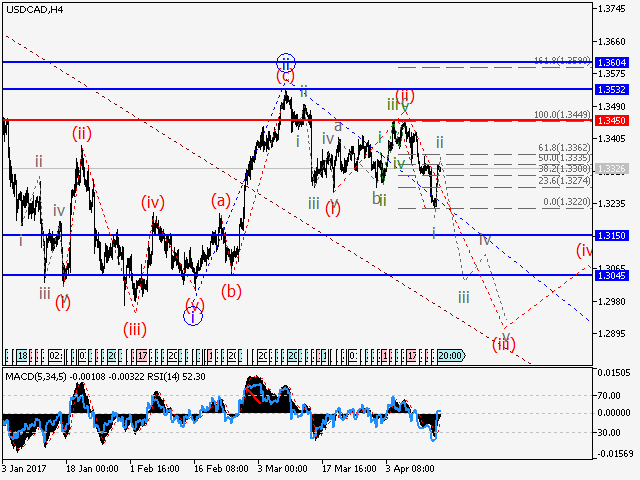
Wave analysis and forecast for 14.04 – 21.04: Downtrend continues.

Estimated pivot point is at the level of 1.3450.

Analysis: Presumably, the formation of the third wave of the senior level iii of C continues, within which upward correction as the wave (ii) has completed. Locally, it is likely that the first wave of the junior level i of (iii) has been formed. If this assumption is correct, after the completion of the upward correction ii of (iii), the pair can continue to decline to 1.3150. Critical level for this scenario is 1.3450.

Alternative scenario: Breakout and consolidation of the price above the level of 1.3450 will trigger further rise in the pair up to 1.3532.

Our opinion: Sell the pair from correction below the level of 1.3450 with the target of 1.3150. In case of breakdown of the level of 1.3450, buy with the target of 1.3532.

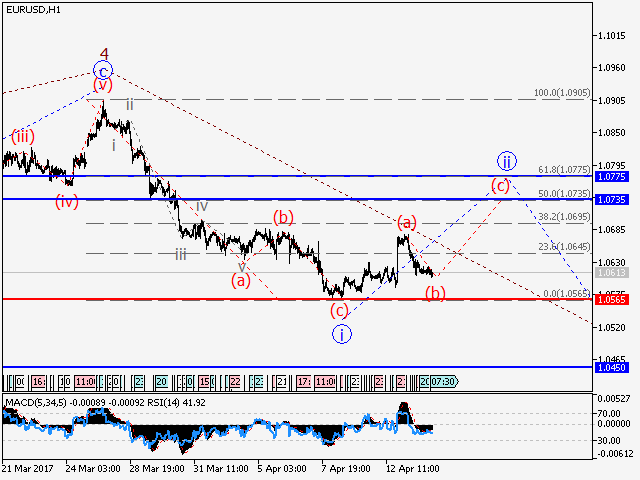
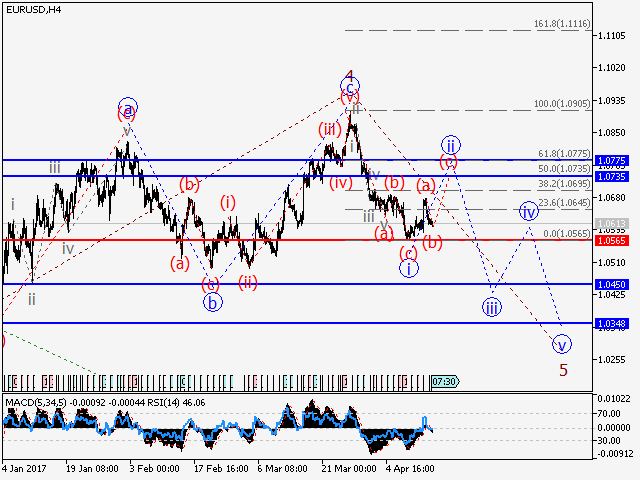
EURUSD Wave analysis and forecast for 14.04 – 21.04

Wave analysis and forecast for 14.04 – 21.04: Downtrend continues. Locally, the pair is undergoing correction.

Estimated pivot point is at the level of 1.0565.

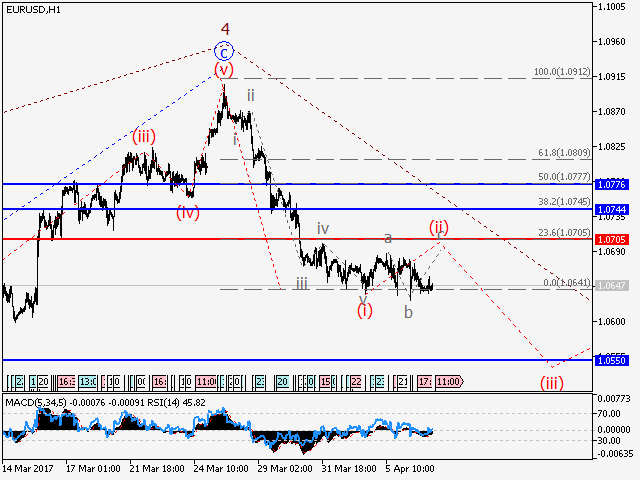
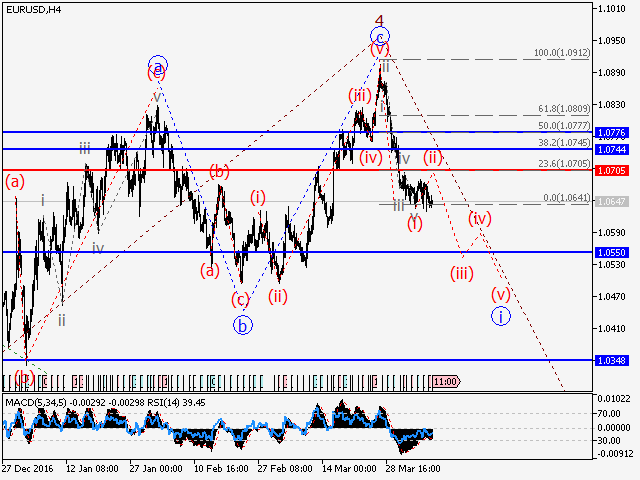
Analysis: Presumably, the formation of the fifth wave 5 of the senior level continues. It seems that the first wave i of 5 in the shape of a zigzag has been formed, which indicates that a diagonal triangle as the fifth wave may be formed. Locally, the upward correction ii of 5 is being developed. If this assumption is correct, upward correction in the pair can go up to 1.0735. Critical level for this scenario is 1.0565.

Alternative scenario: Breakout and consolidation of the price below the level of 1.0565 may trigger further decline in the pair to 1.0450.

Our opinion: Buy the pair from correction above the level of 1.0565 with the target of 1.0735.

USDCAD Wave analysis and forecast for 07.04 – 14.04

USDCAD Wave analysis and forecast for 07.04 – 14.04

Wave analysis and forecast for 07.04 – 14.04: The pair is likely to decline.

Estimated pivot point is at the level of 1.3452.

Analysis: Presumably, the formation of the third wave of the senior level iii of C continues, within which upward correction as the wave (ii) has completed. Locally, it is likely that the first wave of the junior level is being formed. If this assumption is correct, the pair can continue to decline to 1.3260. Critical level for this scenario is 1.3452.

Alternative scenario: Breakout and consolidation of the price above the level of 1.3452 will trigger further rise in the pair up to 1.3532.

  DCAD

Our opinion: Sell the pair from correction above the level of 1.3452 with the target of 1.3260. In case of breakdown of the level of 1.3452, buy with the target of 1.3532.

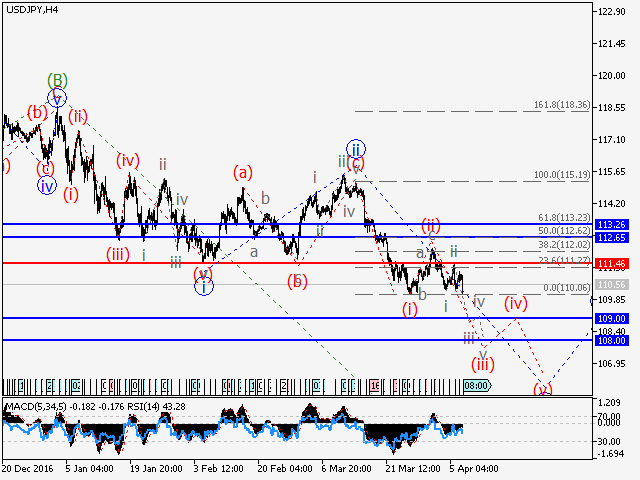
USDJPY Wave analysis and forecast for 07.04 – 14.04

USDJPY Wave analysis and forecast for 07.04 – 14.04

Wave analysis and forecast for 07.04 – 14.04: Downtrend continues.

Estimated pivot point is at the level of 111.46.

Analysis: Presumably, the formation of the third wave iii of the senior level continues. Locally, it is likely that the upward correction (ii) has completed and the third wave (iii) of the junior level is being formed. If this assumption is correct, the pair may continue to decline to 109.00. Critical level for this scenario is 111.46.

Alternative scenario: Breakout and consolidation of the price above the level of 111.46 will trigger further rise in the pair up to 112.65 – 113.26.

Our opinion: Sell the pair from correction below the level of 111.46 with the target of 109.00. In case of breakdown of the level of 111.46, buy with the target of 112.65 – 113.26.

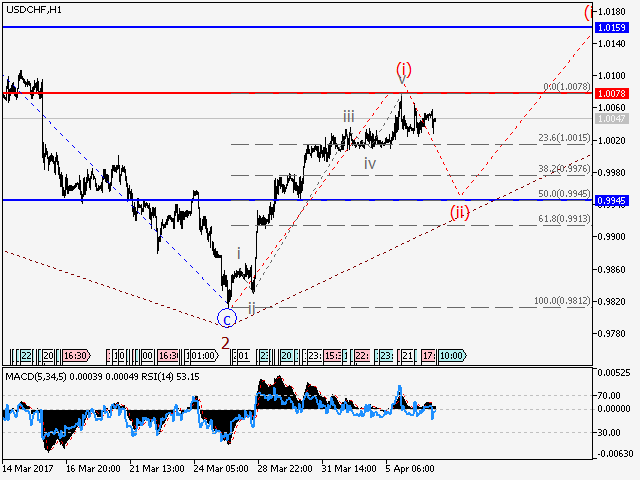
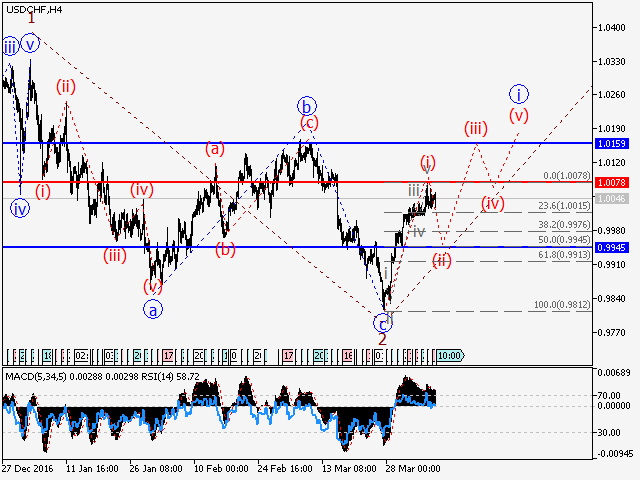
USDCHF Wave analysis and forecast for 07.04 – 14.04

USDCHF Wave analysis and forecast for 07.04 – 14.04

Wave analysis and forecast for 07.04 – 14.04: The pair is likely to decline within correction.

Estimated pivot point is at the level of 1.0078.

Analysis: Presumably, the formation of the third wave 3 of the senior level continues. Locally it seems that the one-two impetus as the wave (i) has been formed. If this assumption is correct, the pair may decline to the level of 0.9945 in the second wave (ii). Critical level for this scenario is 1.0078.

Alternative scenario: Breakout and consolidation of the price above the level of 1.0078 will trigger rise in the pair up to 1.0160.

Our opinion: Sell the pair from correction below the level of 1.0078 with the target of 0.9945.

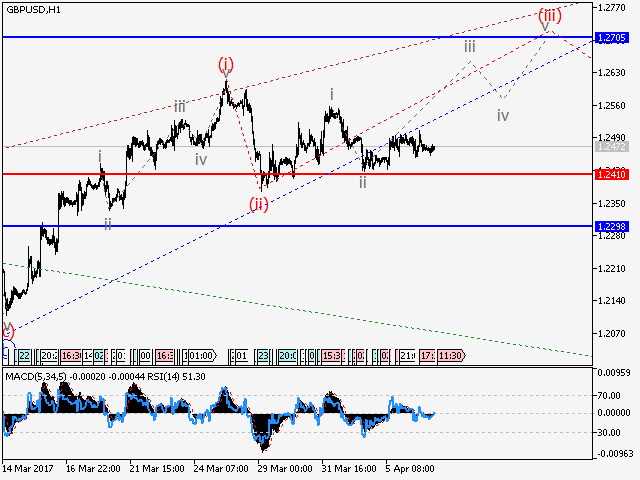
GBPUSD Wave analysis and forecast for 07.04 – 14.04

GBPUSD Wave analysis and forecast for 07.04 – 14.04

Wave analysis and forecast for 07.04 – 14.04: The pair is likely to rise.

Estimated pivot point is at the level of 1.2410.

Analysis: Presumably, the formation of the upward correction as the wave 4 of the senior level continues. Within this wave the wave c of 4 is being developed. Locally, it is likely that third wave (iii) of c is being developed. If this assumption is correct, the pair may continue to rise up to 1.2705. Critical level for this scenario is 1.2410.

Alternative scenario: Breakdown and consolidation of the price below the level of 1.2410 will trigger further decline in the pair to 1.2300.

Our opinion: Buy the pair from correction above the level of 1.2410 with the target of 1.2705.

EURUSD Wave analysis and forecast for 07.04 – 14.04

EURUSD Wave analysis and forecast for 07.04 – 14.04

Wave analysis and forecast for 07.04 – 14.04: Downtrend continues.

Estimated pivot point is at the level of 1.0705.

Analysis: Presumably, the formation of the fifth wave 5 of the senior level continues. It seems that the one-two impetus (i) of the junior level has formed and the local correction as the wave (ii) is being developed taking a shape of a irregular plane. If this assumption is correct, after the completion of the correction the pair may continue to decline to 1.0550. Critical level for this scenario is 1.0705.

Alternative scenario: Breakout and consolidation of the price above the level of 1.0705 may trigger further rise in the pair to 1.0744 – 1.0776.

Our opinion: Sell the pair from correction above the level of 1.0705 with the target of 1.0550.

April 3, 2017 Today’s Technical Analysis About EURUSD and GBPUSD

April 3, 2017 Today’s Technical Analysis About EURUSD and GBPUSD

EUR/USD-daily-fundamental-forecast-april-03-2017

Last Friday, we saw the end of the quarter and the month end as well and the euro was mixed to end the day. This was caused more due to the mixed nature of the dollar rather than any specific event affecting the euro as such. We generally see some month end flows which brings in a bit of volatility in the EURUSD pair and this month end and quarter end flows helped to push the pair further down and we saw the pair moves towards 1.0650 as of last week.

Euro Likely to Consolidate

Today morning, we see a bit of buying in the euro but this is general correction of the move down lower on Friday rather than buying on any specific news or event. Today is the beginning of a new week and a new trading month as well and a lot of news is scheduled to be released during the course of this week. So we can expect some consolidation with a bearish bias during the course of the day as the market and the traders position themselves for the upcoming week.

As is usual with this pair, the moves in this pair is dominated more by the dollar than by the euro in general and so it is all about the dollar strength as of now. The dollar has been buoyed up by the strong data that we saw from the US last week and this is the reason for the fall in the pair over the last week. If the dollar strength continues for today and also for the rest of the week leading upto to the FOMC meeting minutes, we could see the pair sliding further towards the strong support at 1.05 over the next couple of days.

Looking ahead to the rest of the day, we do not have any major news from the Eurozone but we do have the ISM manufacturing PMI data from the US later on in the day. This is not likely to have much impact, especially considering all the major news scheduled for later in the week but we do expect some consolidation with a bearish bias for the rest of the day.

GBP/USD Daily Fundamental Forecast – April 03, 2017


GBPUSD continues to trade strongly amidst some short covering and also due to the month end flows that we saw last week. The pair had risen leading up to the invocation of Article 50 on March 29 and we also noticed an increase in the number of shorts in anticipation of a great fall following the invocation. But what we got was only a fall of 200 pips, more due to an increase in strength of the dollar than due to any major changes in the pound, in the days leading up to the invocation.


GBPUSD Continues to Remain Buoyant

The day of March 29, passed off peacefully without much volatility despite the invocation of Article 50 and this disappointed the bears who had expected a much larger fall. So, in the days after March 29, we saw some short covering as the disappointed bears exited their positions and this led to the rise of the GBPUSD pair from the lows of its range around 1.24 to above 1.25 and it trades comfortably close to 1.2550 as of this writing.

It looks quite bullish at the moment but we believe that the pair is due for some correction of the bounce that it has had so far. This is the first week of the month and with a variety of news loaded for the rest of the week, we would expect some consolidation today. Also, the region around 1.26 had shown a lot of selling the previous time when the price was here and so we expect the same if and when the price visits there again.

Looking ahead to the rest of the day, we have the Manufacturing PMI data from the UK and the PMI data from the US as well and these data are likely to bring in a bit of volatility. We expect any upmove to be capped by the 1.26 region and we expect some consolidation with a bearish bias for the rest of the day.