EURUSD Wave analysis and forecast for 30.06 – 07.07

EURUSD Wave analysis and forecast for 30.06 – 07.07

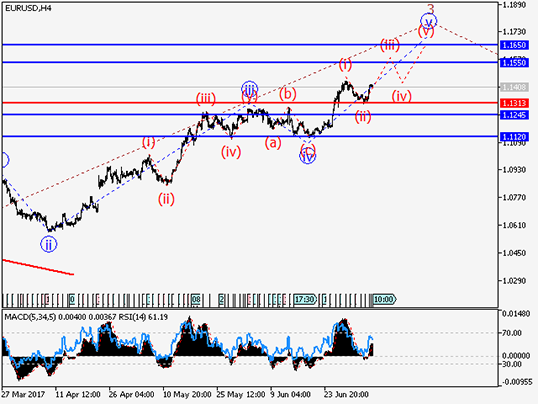
Wave analysis and forecast for 30.06 – 07.07: Uptrend continues.

Estimated pivot point is at the level of 1.1313.

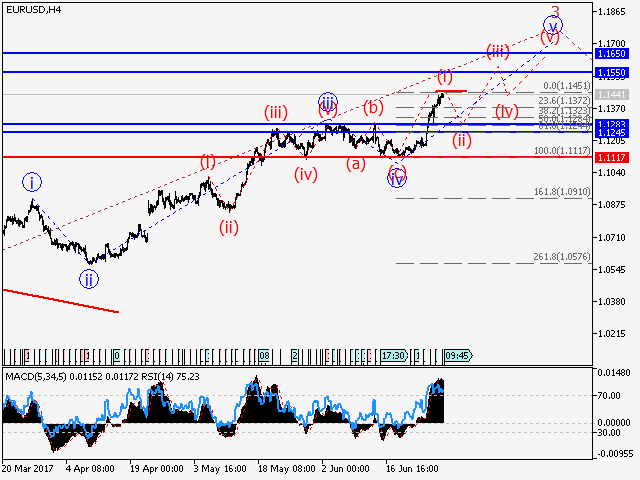
Analysis: Presumably, on the four-hour timeframe the formation of the uptrend continues as third wave of the senior level 3. At the moment, it seems that the fifth wave v of 3 is being formed, within which correction (ii) has completed and the third wave of the junior level (iii) is being developed. If this assumption is correct, the pair may continue to rise up to the levels of 1.1550 – 1.1650. Critical level for this scenario is 1.1313.

Alternative scenario: Breakdown and consolidation of the price below the level of 1.1313 may trigger further decline in the pair to 1.1245.

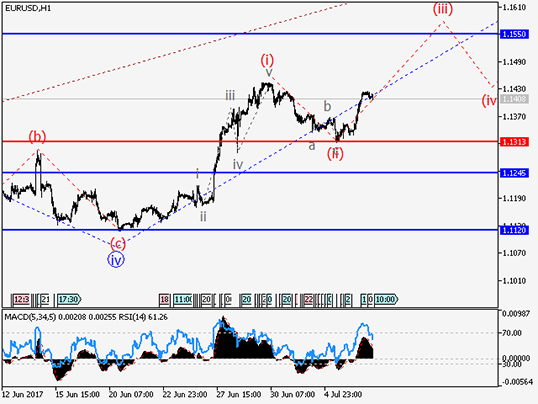
Our opinion: Buy the pair from correction above the level of 1.1313 with the target of 1.1550 – 1.1650.

USDCAD Wave analysis and forecast for 30.06 – 07.07

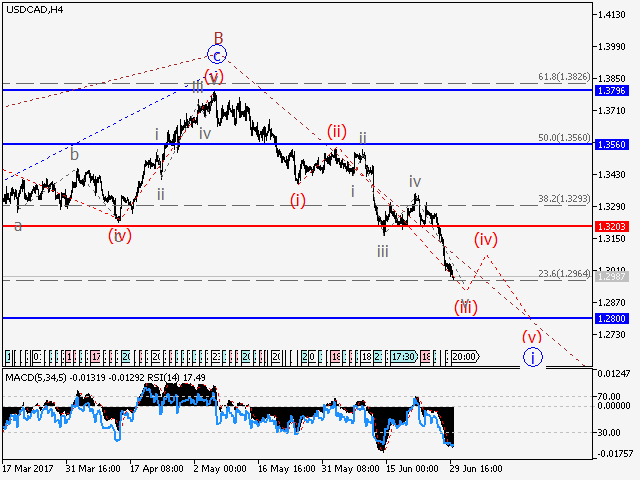
Wave analysis and forecast for 30.06 – 07.07: Downtrend continues.

Estimated pivot point is at the level of 1.3203.

Analysis: Supposedly, a descending impetus continues to develop within the 4-hour time frame in a form of the first wave i of C. Apparently, the third wave of junior level (iii) continues to form locally. If this assumption is correct, then after completion of the upward correction (iv) the pair can continue to decline to 1.2800. Critical level for this scenario is 1.3203..

Alternative scenario: Breakout and consolidation of the price above the level of 1.3203 will trigger further rise in price to 1.3560.

Our opinion: Sell the pair from correction below the level of 1.3347 with the targets at 1.3000 – 1.2964.

USDCHF Wave analysis and forecast for 30.06 – 07.07

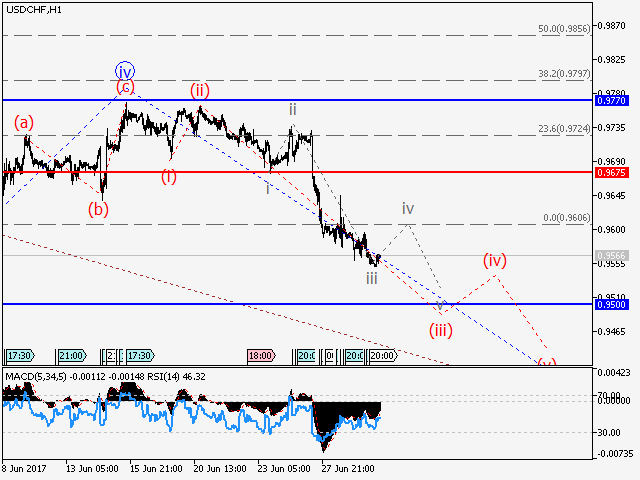
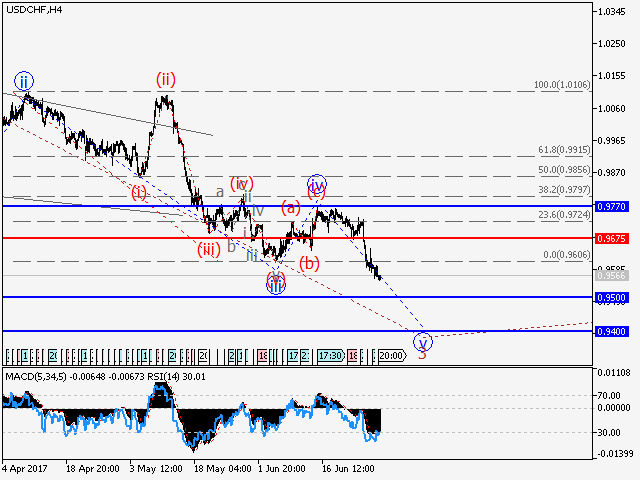
Wave analysis and forecast for 30.06 – 07.07: Downtrend dominates.

Estimated pivot point is at the level of 0.9675.

Analysis: Presumably, on the four-hour timeframe, the formation of the downtrend continues in the third wave 3 of the senior level. Locally it seems that the development of the wave v of 3 continues within which the third wave of the junior level (iii) is being developed. If this assumption is correct, the pair can continue to decline to 0.9500 – 0.9400. Critical level for this scenario is 0.9675.

Alternative scenario: Breakout and consolidation of the price above the level of 0.9675 will trigger further rise in the pair up to 0.9770.

Our opinion: Sell the pair from correction below the level of 0.9675 with the target of 0.9500 – 0.9400. After breakdown at the level of 0.9675, buy with the target of 0.9770.

USDJPY Wave analysis and forecast for 30.06 – 07.07

Wave analysis and forecast for 30.06 – 07.07: The pair is likely to rise.

Estimated pivot point is at the level of 110.90.

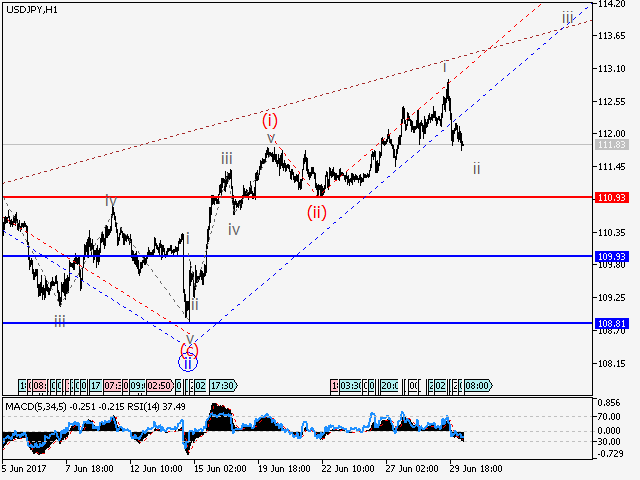
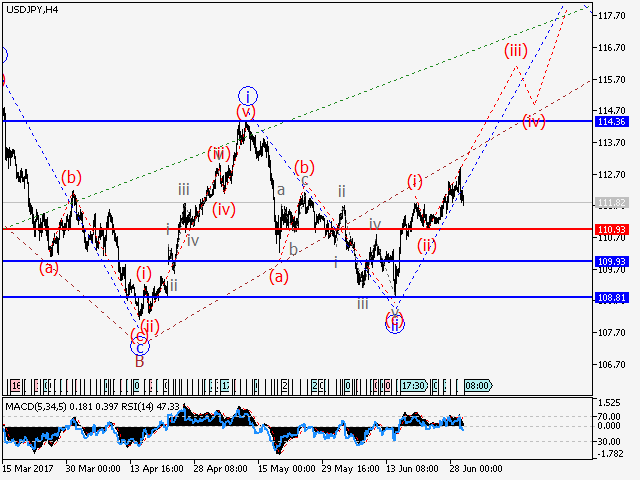
Analysis: Presumably, the formation of the third wave iii continues in the wave C of the senior level. level. Locally, it is likely that the third wave of the junior level (iii) is being developed, within which the correction ii of (iii) is nearing completion. If this assumption is correct, the pair can continue to rise up to 114.36. Critical level for this scenario is 110.90.

Alternative scenario: Breakout and consolidation of the price below the level of 110.90 will trigger further decline in the pair up to 109.90 – 108.80.

USDJPY

Our opinion: Buy the pair from correction above the level of 110.90 with the target of 114.36. In case of breakdown at the level of 110.90, sell with the target of 109.90.

EURUSD Wave analysis and forecast for 30.06 – 07.07

EURUSD Wave analysis and forecast for 30.06 – 07.07

Wave analysis and forecast for 30.06 – 07.07: Uptrend continues. Downward correction is possible.

Estimated pivot point is at the level of 1.1117.

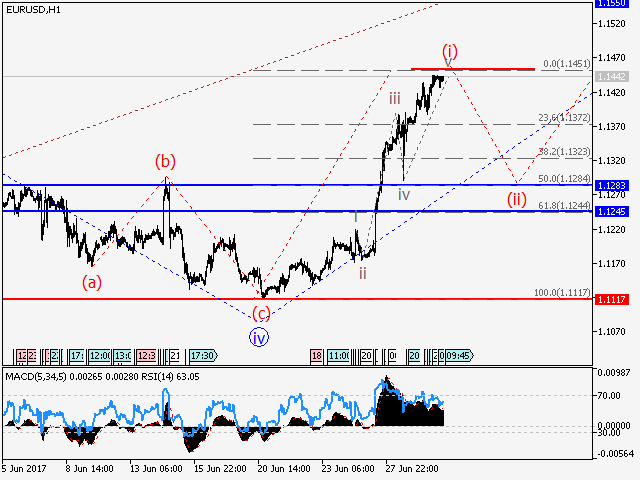
Analysis: Presumably, the formation of the uptrend as third wave of the senior level 3 continues on the four-hour timeframe. At the moment, it seems that the fifth wave v of 3 is being formed, within which upward impetus has been formed as the wave (i) of v. If this assumption is correct, in the short-term the pair can decline as part of the correction to 1.1283 – 1.1245. After the completion of the correction (ii) the pair may continue to rise. Critical level for this scenario is 1.1117.

Alternative scenario: Breakdown and consolidation of the price below the level of 1.1117 may trigger further decline in the pair up to 1.0910.

Our opinion: In the short-term: sell the pair below the level of 1.1450 with the target of 1.1283 – 1.1245. In the medium-term: wait for the completion of the correction (ii) and buy the pair with the target of 1.1550 – 1.1650.

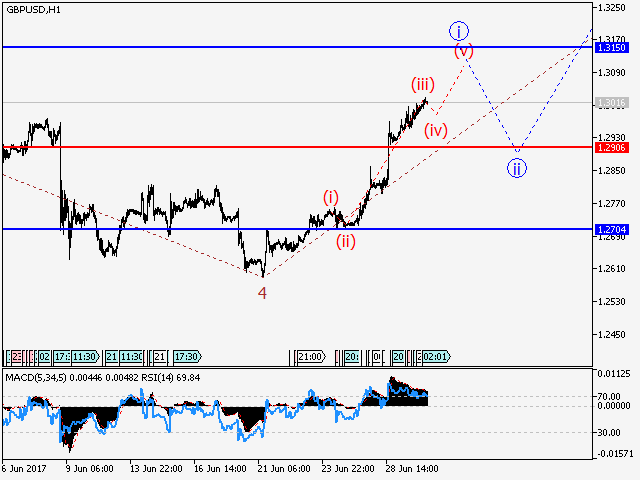
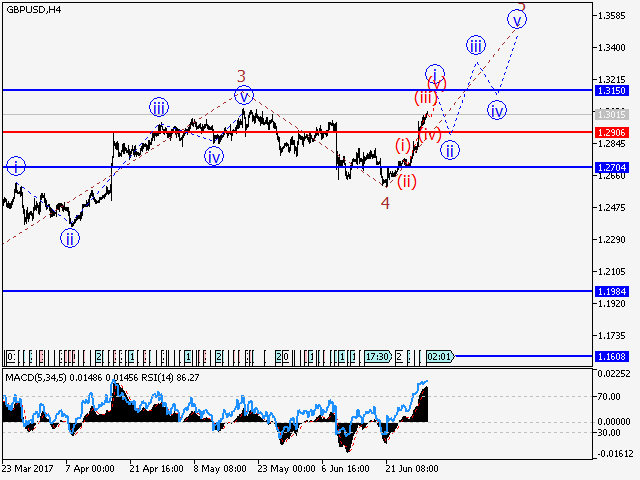
GBPUSD Wave analysis and forecast for 30.06 – 07.07

Wave analysis and forecast for 30.06 – 07.07: Uptrend continues.

Estimated pivot point is at the level of 1.2906.

Analysis: Presumably, the formation of the fifth wave of the senior level continues on the four-hour timeframe. At the moment, it is likely that the formation of the upward impetus as the wave i of 5, continues. If this assumption is correct the pair can continue to rise up to 1.3150. Critical level for this scenario is 1.2906.

Alternative scenario: Breakdown and consolidation of the price below the level of 1.2906 will trigger further decline in the pair to 1.2704.

Our opinion: Buy the pair from correction above the level of 1.2906 with the target of 1.3150. In case of breakdown of the level of 1.2906 sell with the target of 1.2704.

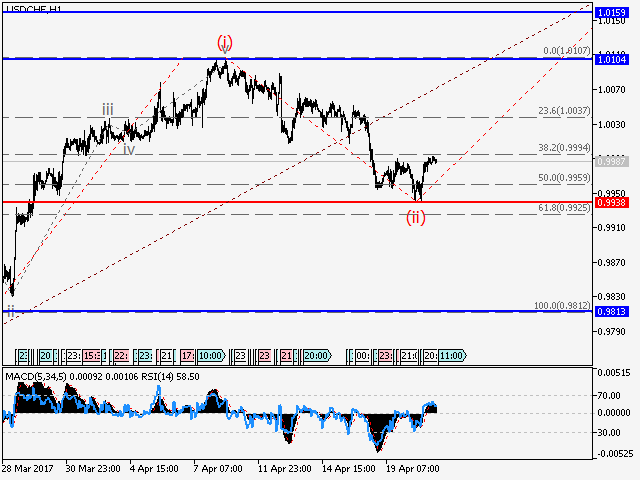
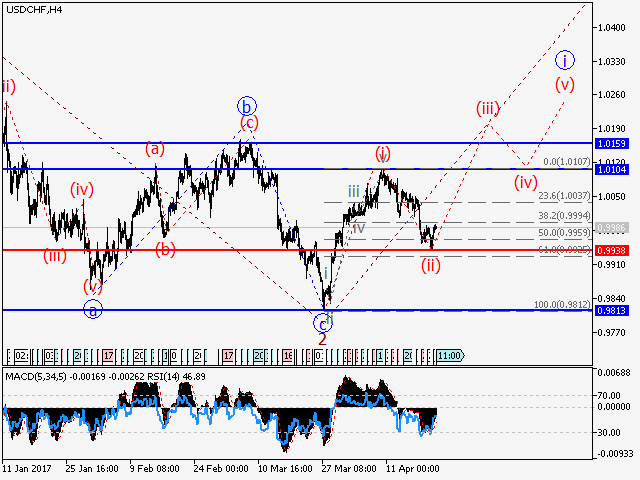
USDCHF Wave analysis and forecast for 21.04 – 28.04

USDCHF Wave analysis and forecast for 21.04 – 28.04

Wave analysis and forecast for 21.04 – 28.04: The pair is expected to grow.

Estimated pivot point is at the level of 0.9938.

Analysis: Supposedly, the third wave 3 of senior level continues to form. Apparently, a counter-trend impetus has been formed as the wave (i) and the descending correction (ii) has reached Fibonacci 50% and finished developing locally. If the presumption is correct, the pair will logically resume rising to a level of 1.0104 – 1.0160 within the third wave (iii). The level 0.9938 is critical in this scenario.

Alternative scenario: Breakout and consolidation below the level of 0.9938 will allow the pair to continue declining to a level of 0.9813.

Our opinion: Buy the pair from correction above the level of 0.9938 with a target of 1.0104 – 1.0160.

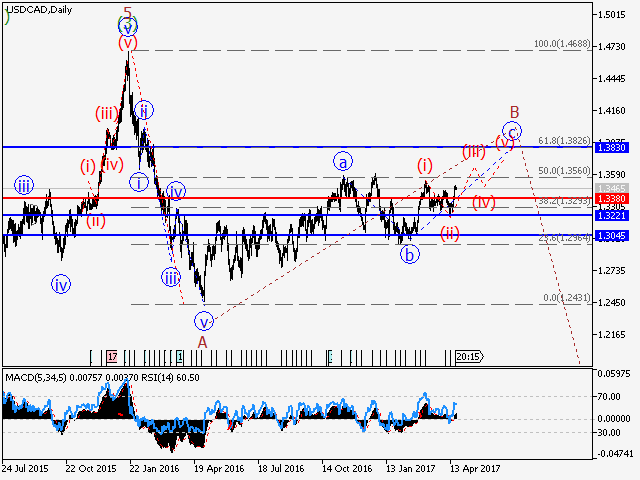
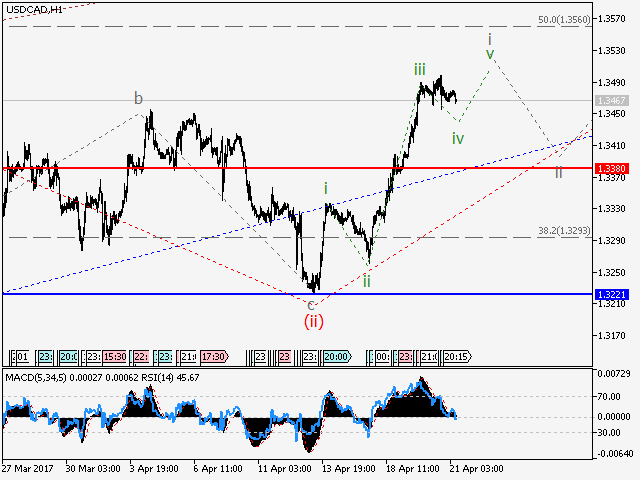
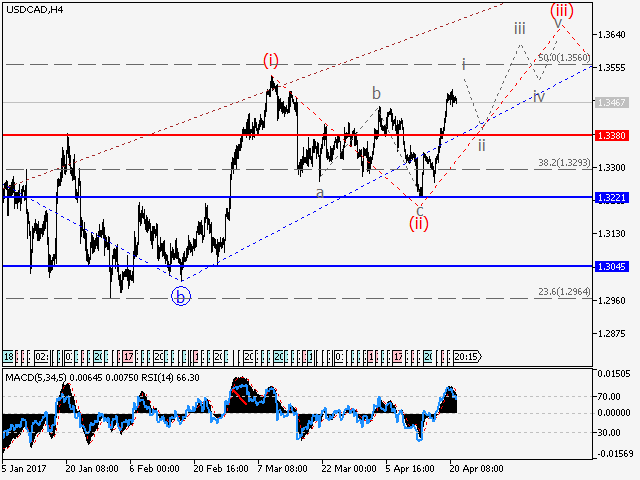
USDCAD Wave analysis and forecast for 21.04 – 28.04

USDCAD Wave analysis and forecast for 21.04 – 28.04

Wave analysis and forecast for 21.04 – 28.04: The pair resumes growth.

Estimated pivot point is at the level of 1.3380.

Analysis: Apparently, a long-term ascending correction within the wave B continues to form. Presumably, the wave c of B is developing locally, with the third wave of junior level (iii) forming within. If the presumption is correct, the pair will continue to rise to the levels 1.3560 – 1.38. The level of 1.3380 may be critical in this scenario as the breakout will enable the pair to continue declining to the level of 1.3220.

Alternative scenario: Breakout and consolidation below the level of 1.3380 will allow the pair to continue declining to the level of 1.3220.

Our opinion: Buy the pair from correction above the level of 1.3380 with a target of 1.3560 – 1.38. Sell the pair with a target at 1.3220 in case the level 1.3380 is broken.

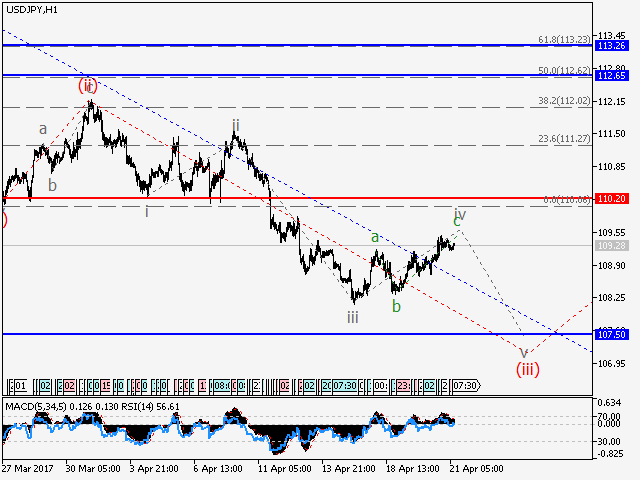
USDJPY Wave analysis and forecast for 21.04 – 28.04

USDJPY Wave analysis and forecast for 21.04 – 28.04

Wave analysis and forecast for 21.04 – 28.04: Downtrend continues.

Estimated pivot point is at the level of 110.20.

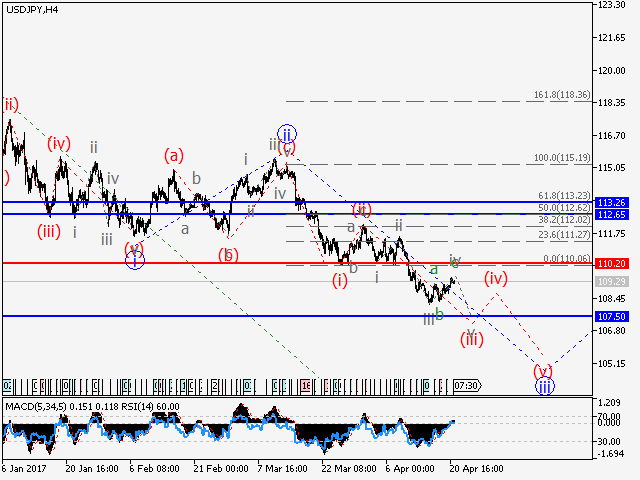
Analysis: Supposedly, a downtrend continues forming within the third wave iii of senior level. Apparently, the third wave (iii) of junior level is developing locally, with an ascending correction iv of (iii) nearing completion inside. If the presumption is correct, the pair will logically continue to drop to the level of 107.50. The level 110.20 is critical in this scenario.

Alternative scenario: Breakout and consolidation above the level of 110.20 will allow the pair to continue the rise up to the levels of 112.65 – 113.26.

Our opinion: Sell the pair from corrections below the level of 110.20 with a target at 107.50.

GBPUSD Wave analysis and forecast for 21.04 – 28.04

GBPUSD Wave analysis and forecast for 21.04 – 28.04

Wave analysis and forecast for 21.04 – 28.04: Uptrend continues.

Estimated pivot point is at the level of 1.2704.

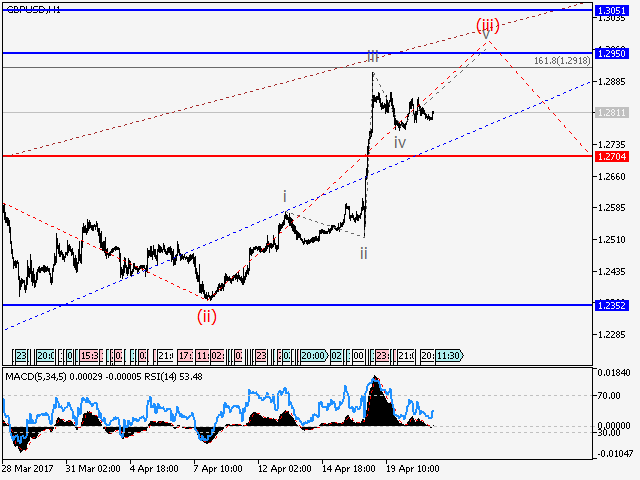
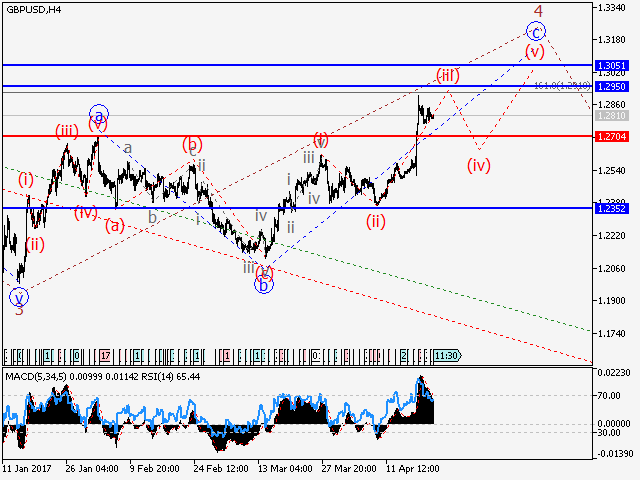
Analysis: Presumably, an ascending correction of senior level continues to form as the fourth wave 4, with the wave c of 4 developing within. Apparently, the third wave (iii) of c continue to form locally, with a bullish impetus developing inside. If the presumption is correct, the pair will continue to rise to the levels 1.2950 – 1.3050. The level 1.2704 is critical in this scenario.

Alternative scenario: Breakout and consolidation below the level of 1.2704 will allow the pair to continue declining to a level of 1.2350.

Our opinion: Buy the pair from correction above the level of 1.2704 with a target of 1.2950 – 1.3050.