EURUSD Wave analysis and forecast for 21.04 – 28.04

EURUSD Wave analysis and forecast for 21.04 – 28.04

Wave analysis and forecast for 21.04 – 28.04: The pair is expected to decline.

Estimated pivot point is at the level of 1.0776.

Analysis: Supposedly, the fifth wave 5 of senior level continues to form. Apparently, the first wave i of 5 has formed as a zigzag-like pattern, which allows us to suppose that a diagonal triangle may form in the fifth wave. Apparently, the ascending correction ii of 5 is completed in a zigzag-like form at a correction level of 62%. If the presumption is correct, the pair will logically resume dropping to the levels 1.0600 – 1.0450. The level 1.0776 is critical in this scenario.
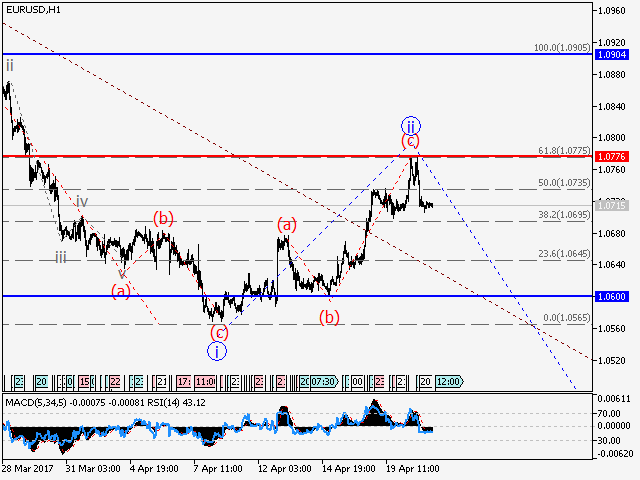
Alternative scenario: Breakout and consolidation above the level of 1.0776 will allow the pair to continue rising to a level of 1.0904.

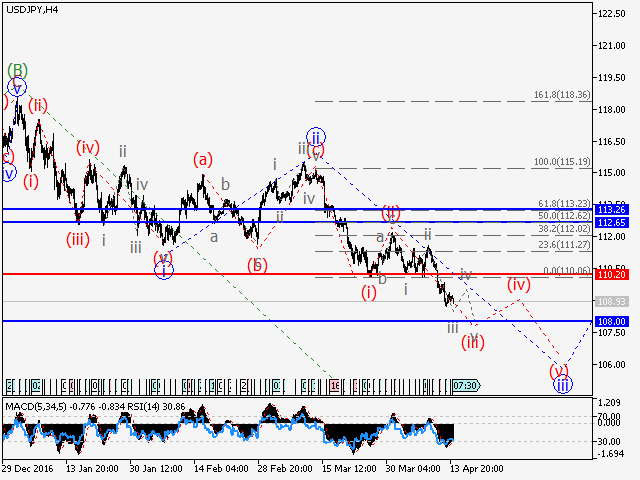
USDJPY Wave analysis and forecast for 14.04 – 21.04

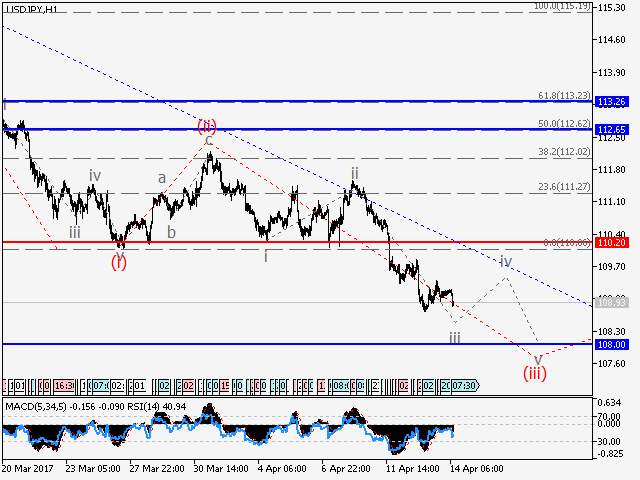
Wave analysis and forecast for 14.04 – 21.04: Downtrend continues.

Estimated pivot point is at the level of 110.20.

Analysis: Presumably, the formation of the third wave iii of the senior level continues. Locally, it is likely that the upward correction (ii) has completed and the third wave (iii) of the junior level is being formed. If this assumption is correct, the pair may continue to decline to 108.00. Critical level for this scenario is 110.20.

Alternative scenario: BBreakout and consolidation of the price above the level of 110.20 will trigger further rise in the pair up to 112.65 – 113.26.

US

Our opinion: Sell the pair from correction below the level of 110.20 with the target of 108.00.

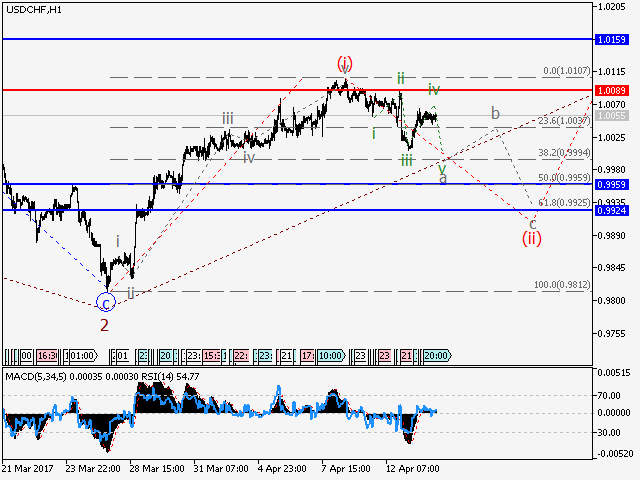
USDCHF Wave analysis and forecast for 14.04 – 21.04

Wave analysis and forecast for 14.04 – 21.04: The decline in the pair is likely to continue.

Estimated pivot point is at the level of 1.0089.

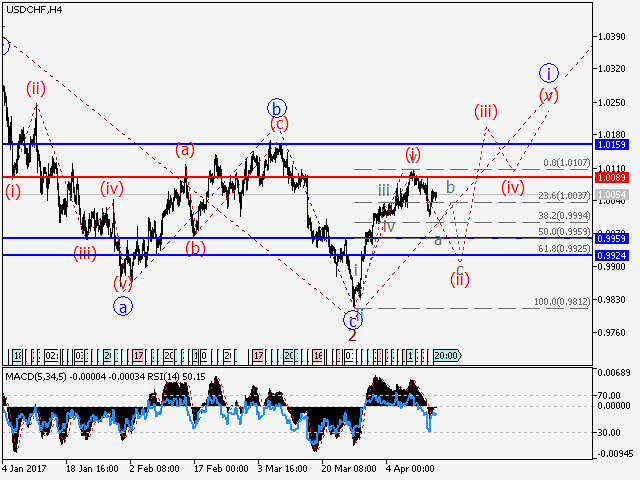
Analysis: Presumably, the formation of the third wave 3 of the senior level continues. Locally it seems that the one-two impetus as the wave (i) has been formed and the downward correction (ii) is being developed. If this assumption is correct, the pair may decline to the level of 0.9960 – 0.9925 in the second wave (ii). Critical level for this scenario is 1.0089.

Alternative scenario: Breakout and consolidation of the price above the level of 1.0089 will trigger rise in the pair up to 1.0160.

Our opinion: Sell the pair from correction below the level of 1.0089 with the target of 0.9960 – 0.9925.

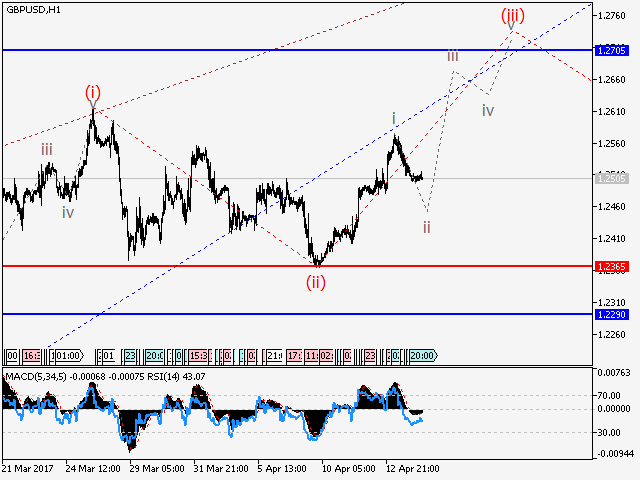
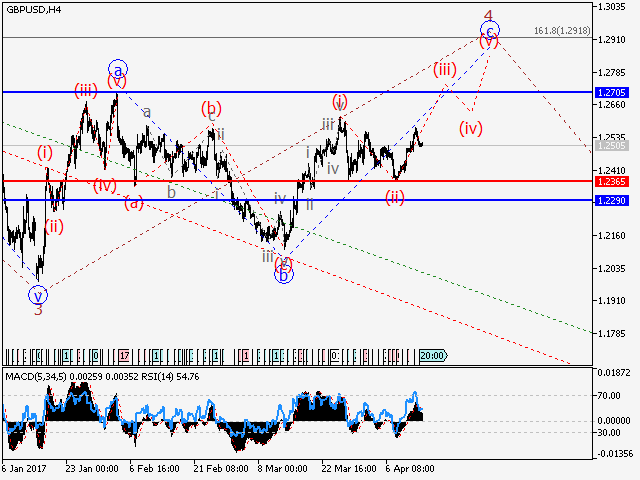
GBPUSD Wave analysis and forecast for 14.04 – 21.04

Wave analysis and forecast for 14.04 – 21.04: Uptrend continues.

Estimated pivot point is at the level of 1.2365.

Analysis: Presumably, the formation of the upward correction as the wave 4 of the senior level continues. Within this wave the wave c of 4 is being developed. Locally, it is likely that third wave (iii) of c is being developed. If this assumption is correct, the pair may continue to rise up to 1.2705. Critical level for this scenario is 1.2365.

Alternative scenario: Breakdown and consolidation of the price below the level of 1.2365 will trigger further decline in the pair to 1.2300.

Our opinion: Buy the pair from correction above the level of 1.2365 with the target of 1.2705.

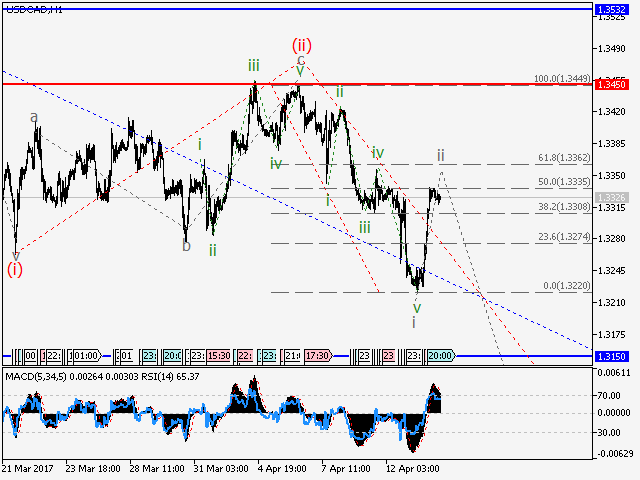
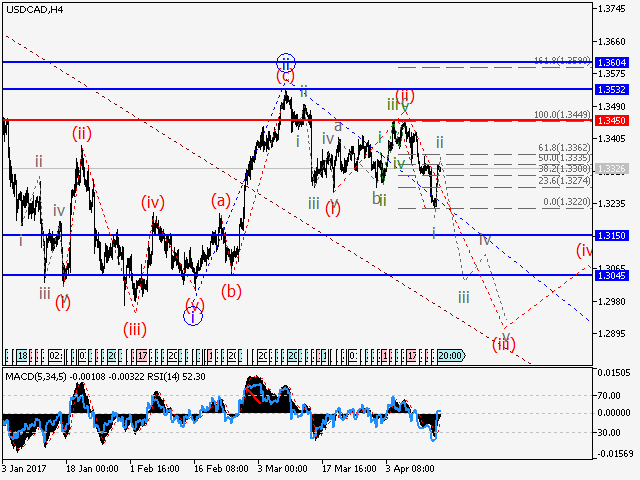
USDCAD Wave analysis and forecast for 14.04 – 21.04

Wave analysis and forecast for 14.04 – 21.04: Downtrend continues.

Estimated pivot point is at the level of 1.3450.

Analysis: Presumably, the formation of the third wave of the senior level iii of C continues, within which upward correction as the wave (ii) has completed. Locally, it is likely that the first wave of the junior level i of (iii) has been formed. If this assumption is correct, after the completion of the upward correction ii of (iii), the pair can continue to decline to 1.3150. Critical level for this scenario is 1.3450.

Alternative scenario: Breakout and consolidation of the price above the level of 1.3450 will trigger further rise in the pair up to 1.3532.

Our opinion: Sell the pair from correction below the level of 1.3450 with the target of 1.3150. In case of breakdown of the level of 1.3450, buy with the target of 1.3532.

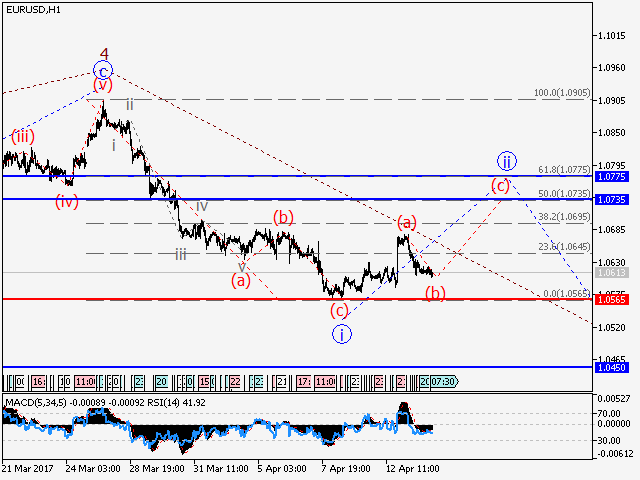
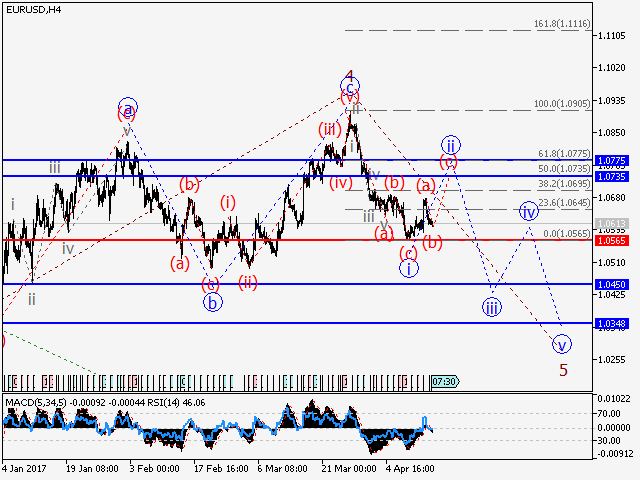
EURUSD Wave analysis and forecast for 14.04 – 21.04

Wave analysis and forecast for 14.04 – 21.04: Downtrend continues. Locally, the pair is undergoing correction.

Estimated pivot point is at the level of 1.0565.

Analysis: Presumably, the formation of the fifth wave 5 of the senior level continues. It seems that the first wave i of 5 in the shape of a zigzag has been formed, which indicates that a diagonal triangle as the fifth wave may be formed. Locally, the upward correction ii of 5 is being developed. If this assumption is correct, upward correction in the pair can go up to 1.0735. Critical level for this scenario is 1.0565.

Alternative scenario: Breakout and consolidation of the price below the level of 1.0565 may trigger further decline in the pair to 1.0450.

Our opinion: Buy the pair from correction above the level of 1.0565 with the target of 1.0735.

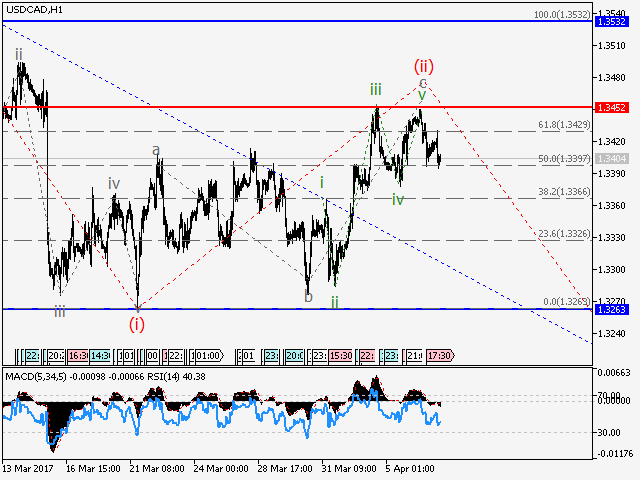
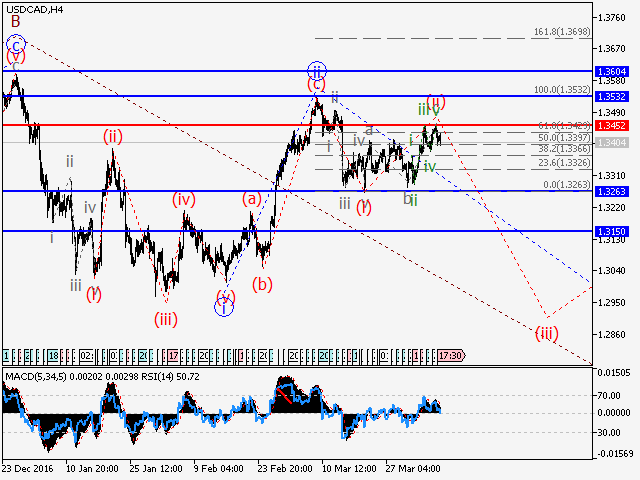
USDCAD Wave analysis and forecast for 07.04 – 14.04

USDCAD Wave analysis and forecast for 07.04 – 14.04

Wave analysis and forecast for 07.04 – 14.04: The pair is likely to decline.

Estimated pivot point is at the level of 1.3452.

Analysis: Presumably, the formation of the third wave of the senior level iii of C continues, within which upward correction as the wave (ii) has completed. Locally, it is likely that the first wave of the junior level is being formed. If this assumption is correct, the pair can continue to decline to 1.3260. Critical level for this scenario is 1.3452.

Alternative scenario: Breakout and consolidation of the price above the level of 1.3452 will trigger further rise in the pair up to 1.3532.

  DCAD

Our opinion: Sell the pair from correction above the level of 1.3452 with the target of 1.3260. In case of breakdown of the level of 1.3452, buy with the target of 1.3532.

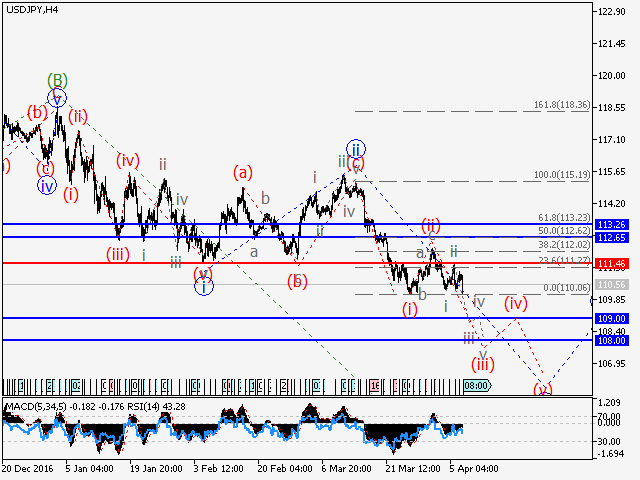
USDJPY Wave analysis and forecast for 07.04 – 14.04

USDJPY Wave analysis and forecast for 07.04 – 14.04

Wave analysis and forecast for 07.04 – 14.04: Downtrend continues.

Estimated pivot point is at the level of 111.46.

Analysis: Presumably, the formation of the third wave iii of the senior level continues. Locally, it is likely that the upward correction (ii) has completed and the third wave (iii) of the junior level is being formed. If this assumption is correct, the pair may continue to decline to 109.00. Critical level for this scenario is 111.46.

Alternative scenario: Breakout and consolidation of the price above the level of 111.46 will trigger further rise in the pair up to 112.65 – 113.26.

Our opinion: Sell the pair from correction below the level of 111.46 with the target of 109.00. In case of breakdown of the level of 111.46, buy with the target of 112.65 – 113.26.

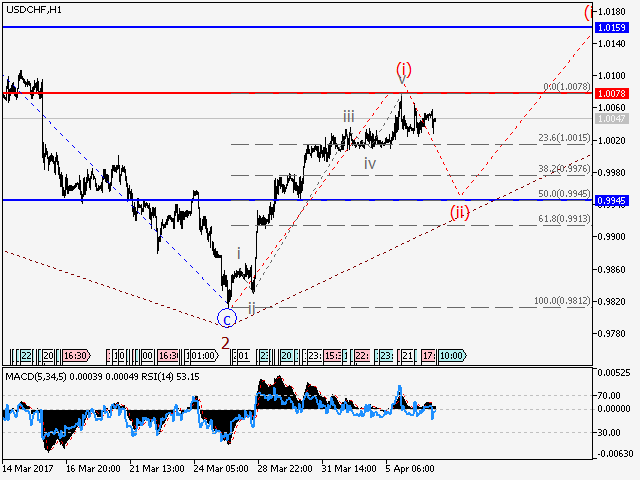
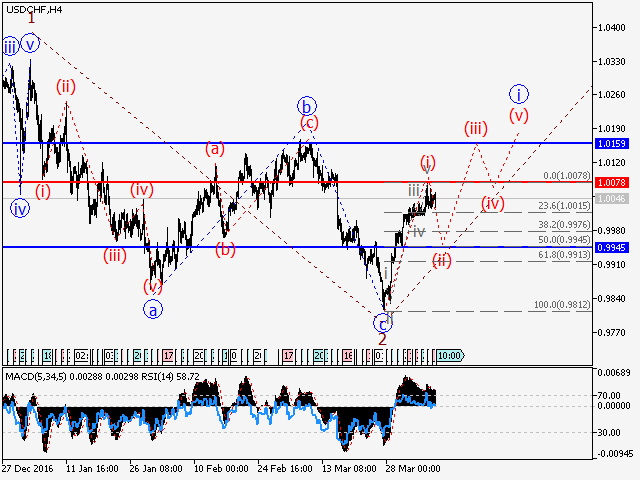
USDCHF Wave analysis and forecast for 07.04 – 14.04

USDCHF Wave analysis and forecast for 07.04 – 14.04

Wave analysis and forecast for 07.04 – 14.04: The pair is likely to decline within correction.

Estimated pivot point is at the level of 1.0078.

Analysis: Presumably, the formation of the third wave 3 of the senior level continues. Locally it seems that the one-two impetus as the wave (i) has been formed. If this assumption is correct, the pair may decline to the level of 0.9945 in the second wave (ii). Critical level for this scenario is 1.0078.

Alternative scenario: Breakout and consolidation of the price above the level of 1.0078 will trigger rise in the pair up to 1.0160.

Our opinion: Sell the pair from correction below the level of 1.0078 with the target of 0.9945.