USD/CHF Wave analysis and forecast for 10.03 – 17.03

Wave analysis and forecast for 10.03 – 17.03: The pair is undergoing correction. The decline is likely to continue.

Estimated pivot point is at the level of 1.0157.

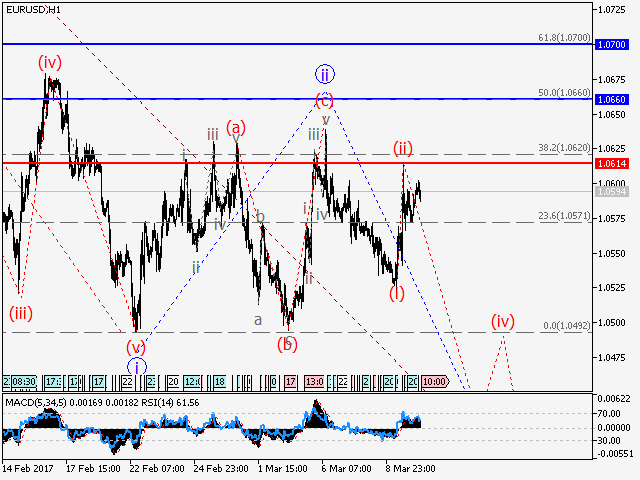
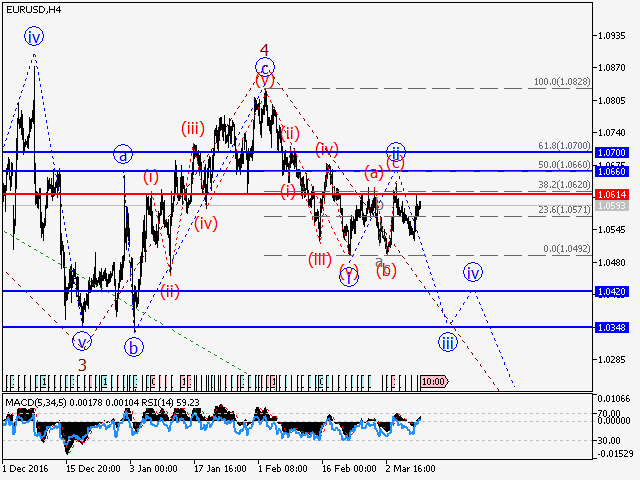
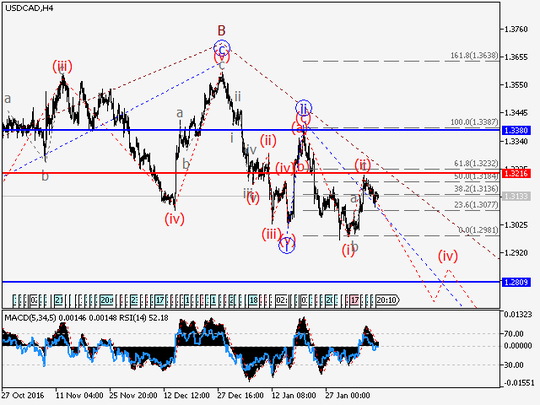
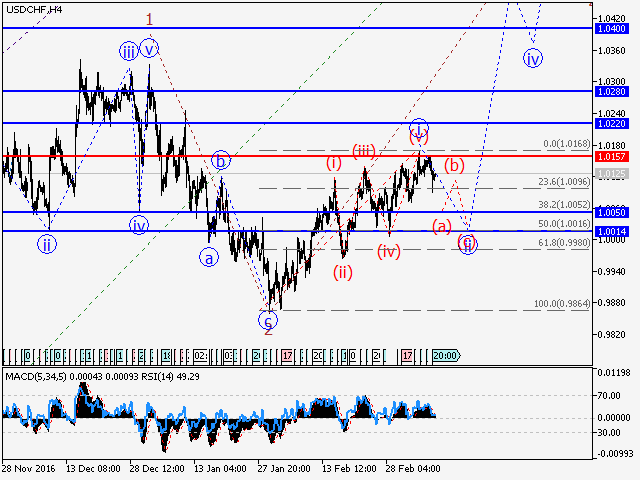
Analysis: Presumably, the formation of the first wave I within the third wave of the senior level continues. Locally, it is likely that the downward correction ii of 3 is being developed within which a wave (a) is being formed. If this assumption is correct, the decline in the pair can continue to 1.0050 – 1.0014. Critical level for this scenario is 1.0157.

Alternative scenario: Breakout and consolidation of the price above the level of 1.0157 will trigger the rise in the pair to 1.0220 – 1.0280.

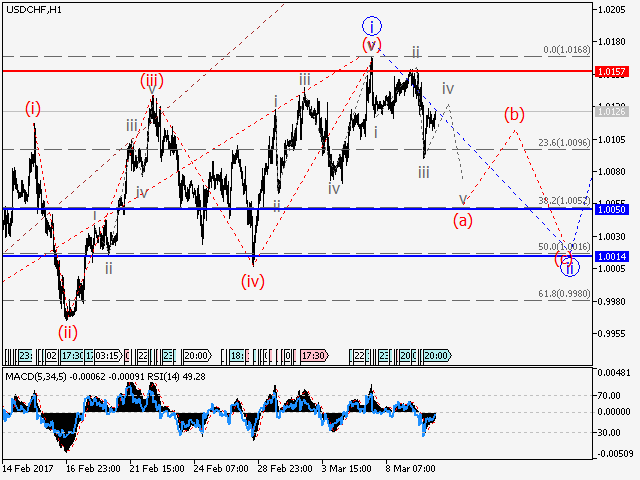
Our opinion: Sell the pair from correction below the level of 1.0157 with the target of 1.0050 – 1.0014.

GBP/USD Wave analysis and forecast for 10.03 – 17.03

GBP/USD Wave analysis and forecast for 10.03 – 17.03

Wave analysis and forecast for 10.03 – 17.03: The pair is likely to rise.

Estimated pivot point is at the level of 1.2131.

Analysis: Presumably, the formation of the upward correction as the wave 4 of the senior level continues. Locally, it seems that the wave (c) of b of 4 has completed. If this assumption is correct, the pair may resume growth up to 1.2300 – 1.2476. Critical level for this scenario is 1.2131. Breakdown of this level may trigger further decline in the pair up to 1.1989.

Alternative scenario: Breakout and consolidation of the price below the level of 1.2131 will trigger further decline in the pair to 1.1989.

Our opinion: Sell the pair from correction above the level of 1.2131 with the target of 1.2300 – 1.2476.

EUR/USD Wave analysis and forecast for 10.03 – 17.03

EUR/USD Wave analysis and forecast for 10.03 – 17.03

Wave analysis and forecast for 10.03 – 17.03: The pair is likely to decline.

Estimated pivot point is at the level of 1.0614.

Analysis: Presumably, the formation of the fifth wave 5 of the senior level continues, within which the third wave iii of 5 is being developed. Locally, it seems that the upward correction as the wave (ii) of iii is completed. If this assumption is correct, the pair may continue to decline to 1.0420 – 1.0350. Critical level for this scenario is 1.0614.

Alternative scenario: Breakout and consolidation of the price above the level of 1.0614 may trigger further rise in the pair up to 1.0660 – 1.0700.

Our opinion: Sell the pair from correction below the level of 1.0614 with the target of 1.0420.

Gold spot Intraday: key resistance at 1248.80. 01. March 2017

Gold spot Intraday: key resistance at 1248.80. 01. March 2017

Pivot: 1248.80

Our preference: short positions below 1248.80 with targets at 1240.75 & 1235.50 in extension.

Alternative scenario: above 1248.80 look for further upside with 1252.00 & 1258.50 as targets.

Comment: the RSI is bearish and calls for further decline.


USD/CAD Wave analysis and forecast for 10.02 – 17.02

USD/CAD Wave analysis and forecast for 10.02 – 17.02: Downtrend dominates.

Estimated pivot point is at the level of 1.3216.

Our opinion: Sell the pair from correction below the level of 1.3216 with the target of 1.2809.

Alternative scenario: Breakout and consolidation of the price above the level of 1.3216 will trigger further rise in the pair up to 1.3380.

Analysis: Presumably, the formation of the wave C of the senior level continues.
Locally it is likely that the upward correction ii of C has developed and the third wave iii of C is being formed, within which the wave (ii) has completed and the third wave of the junior level (iii) is being formed. If this assumption is correct, the pair may continue to decline to 1.2809. Critical level for this scenario is 1.3216. After breaking out this level, the pair will continue to rise up to 1.3380.